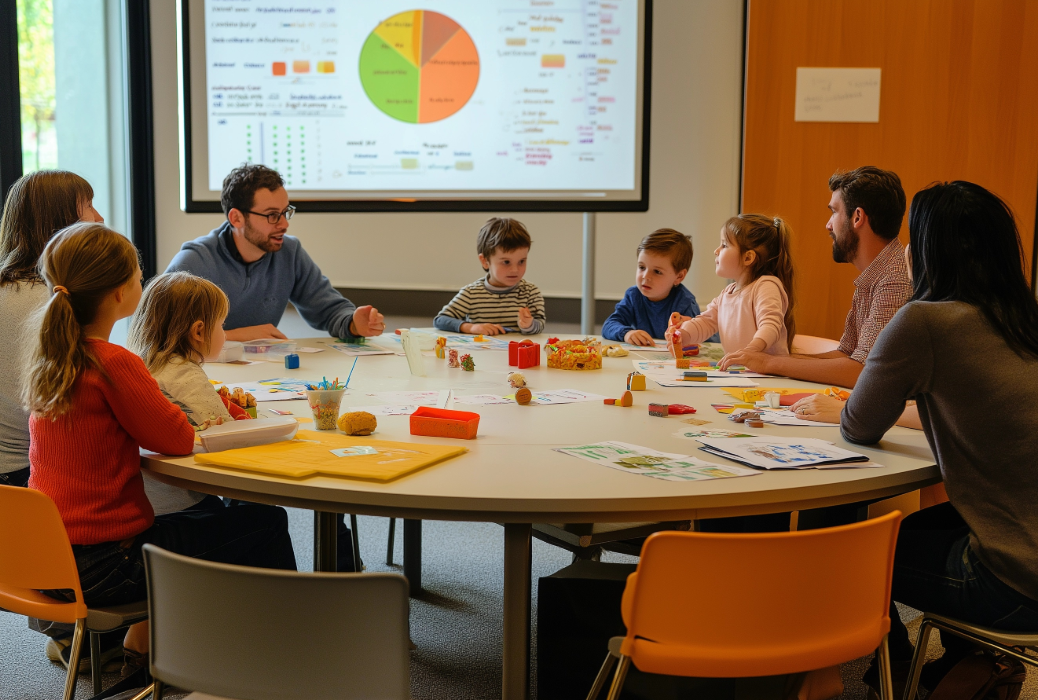

Data becomes powerful only when it’s easy to understand and act upon. After gathering rich insights from children and families, Kid-Friendly World creates dynamic, user-friendly dashboards that transform survey responses, observations, and experiments into clear, actionable visuals.
Dashboards allow you to quickly see where families feel welcomed, where improvements are needed, and what features drive loyalty. Whether you’re managing a hotel, organizing an event, or planning a destination strategy, visual data tools make it easier to communicate findings, prioritize actions, and measure progress over time.
By combining emotional mapping, satisfaction tracking, journey analysis, and behavioral data, we create dashboards that reveal the full story of family experiences. Simple, interactive visualizations help both leadership teams and frontline staff stay aligned with family needs and goals.
Our data visualization and analytics services include:
• Designing interactive family experience dashboards
• Mapping emotional journeys through spaces and services
• Visualizing key metrics like satisfaction, loyalty, and engagement
• Supporting continuous improvement with easy-to-use reporting tools